© 2024 | All Right Revered.
Bridging the gap between Data Science and Decision-Makers to adopt a more data-driven approach.

Founder & CEO | Datics AI
A data scientist turned entrepreneur, on a mission to revolutionize tech ecosystem and empower companies in their digital transformation journey.

Data science intertwines computer science, statistics, and mathematics to extract valuable insights from complex data sets, highlighting its growing relevance in the world of modern business, where data-driven strategies are crucial.
In the process of data analysis, data scientist employs various tools to sift through data, uncover patterns, and present them visually, ultimately creating predictive models and useful recommendations. Data science’s wide-ranging impact spans across fields such as healthcare, finance, retail, and manufacturing, necessitating a continually evolving skill set that includes programming languages like R and Python, statistical understanding, and advanced machine learning techniques.
Amidst these technical skills, the art of effective communication emerges as a critical aspect for data experts. Conveying complex findings to non-technical individuals and collaborating seamlessly with diverse teams like product managers and engineers is vital for successfully integrating data-driven solutions.
Remembering the advice of my college mentor, who emphasized the challenge of explaining numerical concepts, underscores the crucial role of effective communication in unlocking the genuine potential of data-driven insights.
Therefore, delving into the intricacies of effective communication within and beyond the sphere of data science is key to fostering a unified and comprehensive understanding among diverse audiences. Accordingly, below are the seven simple principles that can assist you in maximizing the potential of your data.
The phrase “data driven” resonates frequently in the business sphere, but what does it truly signify? Simply put, being data driven entails making decisions based on concrete data rather than relying solely on intuition or gut feelings. Nevertheless, this doesn’t imply dismissing your instincts entirely, as they often stem from years of experience.
When making critical choices, allowing data science to steer the way is paramount. The importance of being data driven becomes evident on multiple fronts. Firstly, it enables you to make well-informed decisions backed by solid evidence. Secondly, it helps in steering clear of biases and personal inclinations, thereby leading to more sound overall decisions. Finally, relying on data for decisions allows ongoing testing and enhancement, a procedure that becomes notably challenging if solely reliant on intuition and guesswork.
However, putting this strategy into action presents its own challenges. To become truly data driven, you require accurate, timely, and pertinent data. Such data can stem from various sources like surveys, customer feedback, social media interactions, and website analytics. Once acquired, this data needs thorough analysis to uncover trends and patterns.
This analytical journey aids in making well-informed decisions about business strategies and operations. Developing a culture centered around data requires a continuous process of gathering and analyzing data. Ensuring your team understands the significance of data through workshops and basic education should form a fundamental aspect of your business plan.
Data analysis should never be seen as a niche task relegated to the data scientists in the company; rather, it should be an inclusive practice integrated throughout the company to foster a comprehensive understanding and effective utilization of data.
Within the world of data science, storytelling serves as a means to convey insights derived from data. This could involve the use of visual representations, comprehensive reports, or even simple discussions about the data at hand. The objective is to articulate findings in a manner that is easily comprehensible and resonates with the intended audience.
Data storytelling can take various forms. For instance:
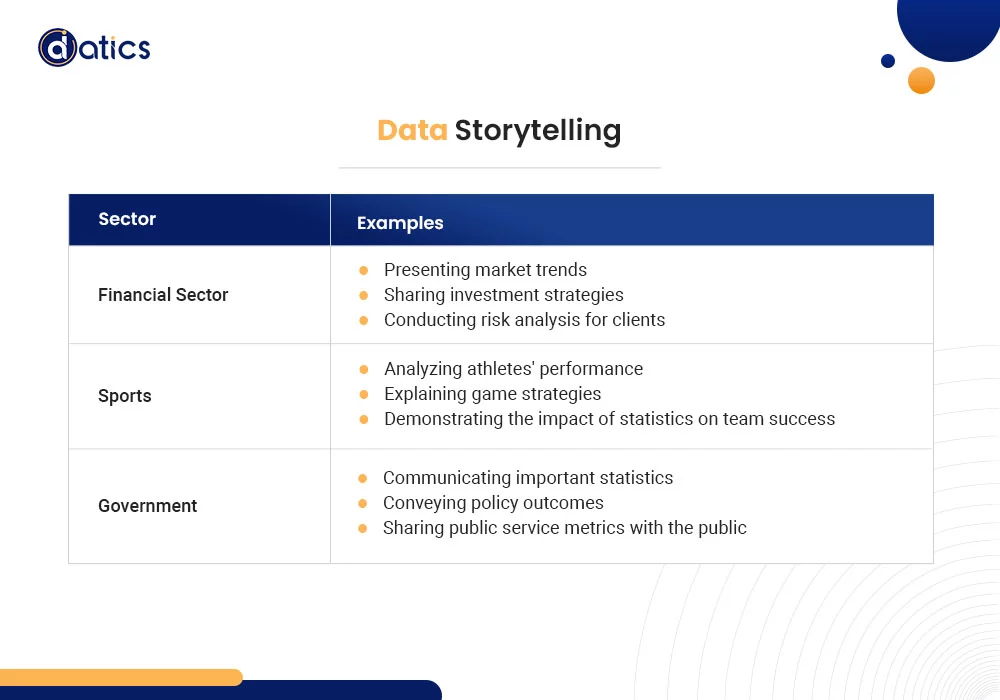
What remains pivotal is that these narratives are firmly grounded in factual evidence extracted from the data. This approach strengthens the credibility of the story, ensuring its clarity, conciseness, and overall persuasiveness.
Additionally, the narrative should be engaging and informative, steering clear of excessive technical jargon. Data-driven storytelling can serve the purpose of elucidating complex concepts, revealing trends over time, or even simply entertaining the audience.
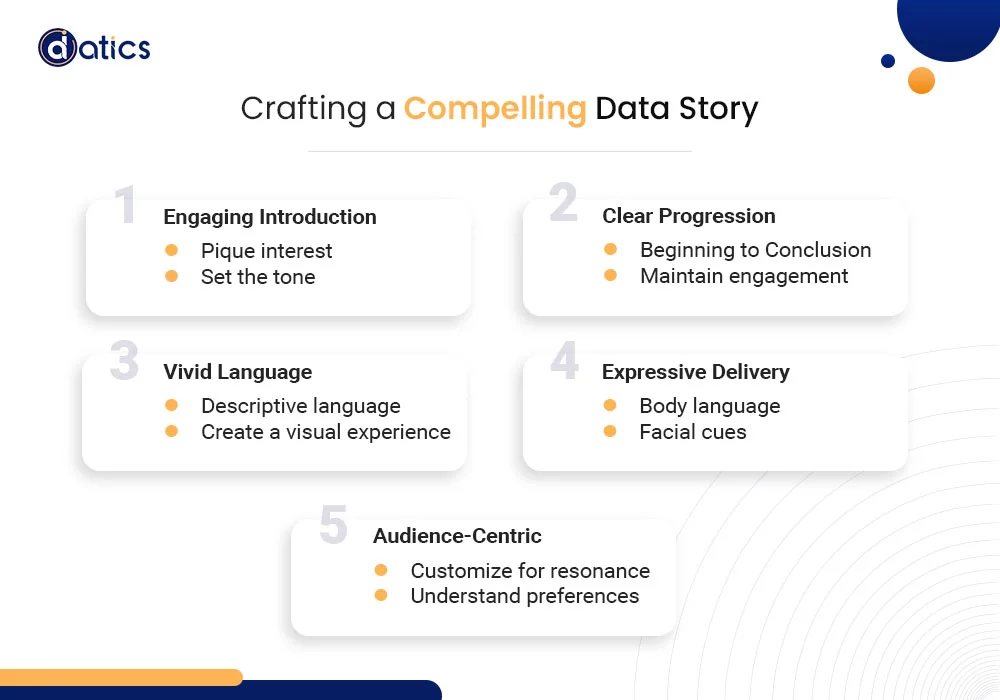
Mastering the art of data storytelling is a critical skill for any data professional, as it enables effective communication of findings to a diverse audience. So, how does one effectively craft a compelling data story? Here are some guiding principles:
Begin with a captivating introduction to pique interest and establish the narrative’s tone.
While these strategies may seem similar to basic storytelling advice, they play a pivotal role in data science storytelling. The key distinction lies in the foundation of your narrative, firmly rooted in data insights rather than imaginative fiction or fairy tales.
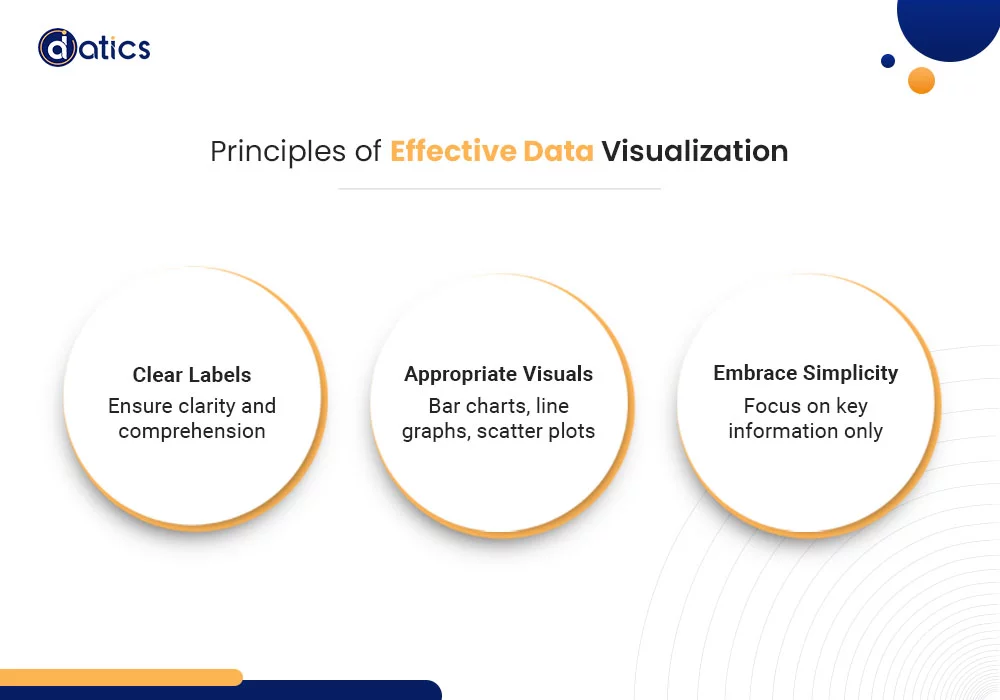
Data visualization stands as a cornerstone in the arsenal of every data analyst. It enables the transformation of vast, intricate data sets into accessible visual representations, facilitating informed decision-making. The significance of data visualization extends beyond analysts, encompassing anyone seeking to derive meaning from data in our increasingly data-oriented world.
In this landscape, the ability to swiftly comprehend and convey information holds great value. Diverse approaches exist for visualizing data, with the optimal method determined by the data type under analysis and the objectives of the analyst. Nevertheless, there exist overarching principles that govern all effective visualizations:
Many data scientists mistakenly assume that people swiftly pick up even the most fundamental statistical concepts, but this is wishful thinking. It’s essential to understand that most individuals may struggle with basic elements, such as a correlation matrix, until a more intuitive approach is presented.
Consider, for instance, comparing a correlation matrix filled with numbers to a heat map. While their underlying structure remains identical, the incorporation of colors in the heat map renders it remarkably intuitive. When important information is emphasized by red squares, people are naturally drawn to it and quickly grasp its significance.
Furthermore, echoing one of Python’s fundamental principles, prioritize clarity over ambiguity. Even the most apparent concepts should be communicated with the assumption that audiences may lack prior knowledge. It’s always preferable to provide thorough explanations rather than present vague or incomplete information.
The realm of machine learning can seem complex, involving intricate mathematics and statistics. To grasp its functioning, one must familiarize themselves with concepts like linear algebra, calculus, and probability. For instance, the hidden layer operations in neural networks are still mysterious because they operate in the background to convert inputs into useful outputs. This makes neural networks similar to black box models.
Similar data science black box models involve support vector machines and random forests. Their intricacy lies in the challenge of understanding the mechanisms behind their predictive capabilities. This can prove troublesome when attempting to comprehend the rationale behind certain model decisions.
In my experience, when communicating uncertainty about the decision-making process to a decision-maker, resistance often arises. People typically display a dislike for uncertainty, but in the case of these powerful models, their functioning remains covered in mystery.
Consider, for instance, OpenAI’s advanced models, such as GPT- 4 or DALL-E, utilized for text and image generation. Why they make the choices they do remains unknown, raising questions about their reliability. However, in practice, these models have consistently demonstrated remarkable feats time and again.
Reliability stands paramount. When a model consistently delivers accurate outcomes, it becomes challenging to question its efficacy. Therefore, even in the absence of a comprehensive understanding of its decision-making process, if a model has proven its worth in the past, granting it the benefit of the doubt seems wise.
Conversely, a compelling argument in favor of trusting AI is its reliance on massive datasets for training. For instance, GPT-4 has been trained on 1 petabyte of text, surpassing the amount of information a single individual could consume in a lifetime.
Furthermore, these strategies aim to promote understanding and acceptance of artificial intelligence:
Simplicity is crucial in successful data science. The KISS principle (keep it simple, stupid) holds more weight here than anywhere else. Overcomplicating data analysis can result in flawed decision-making. Instead, businesses should concentrate on a few primary objectives, utilizing data to accomplish these goals. By maintaining simplicity and focus, businesses can optimize their data use and ensure it contributes to informed decision-making.
For instance, opt for a straightforward regression model instead of a complex one when appropriate. While the allure of constructing a deep learning model and observing its predictions is enticing, employing it for a task involving only two predictive variables is akin to using a sledgehammer to crack a nut. This approach wastes valuable time and resources, needlessly introducing unnecessary complexity.
While data holds significance, it’s not the sole determinant. At times, it can lead us down the wrong path. We’ve witnessed such instances in the media, where companies heavily rely on data and end up with regrettable outcomes. Such occurrences could stem from faulty or insufficient data, or the disregard of other pivotal factors not accounted for in the data analysis.
Hence, it’s imperative for businesses to recognize that data isn’t the ultimate solution, and they should integrate their discernment when relying on it for decisions. Likewise, both data scientist and decision-makers should have faith in their instincts.
Although this sense of intuition may sound mystical, it is frequently our brains alerting us to a problem without our conscious knowledge. Acknowledging these feelings as additional data points can lead to a more holistic decision-making process.
Amidst their complex data constructions, data scientists carefully assemble and refine data methodologies to ensure the accuracy and reliability of their analytical findings. Sometimes, people see data a scientists as skilled architects carefully planning and perfecting complex structures in their workplaces (the careful planning and dedication might be true, but it’s not magic).
In addition to crafting a compelling narrative, it’s crucial to clarify the process behind its creation. Put simply, we should discuss our methodologies.
For instance, we’re aware that data can carry biases. This has garnered significant attention recently, with companies being accused of employing biased data that discriminates against specific groups. For example, in the context of criminal justice, data biases have promoted the stereotype of specific racial or ethnic groups being more susceptible to criminal activities. This can result in unfairness and even discrimination.
What measures did you implement to address this? How did you refine your data? What measures did you implement to prevent your AI from developing consciousness and posing a threat to humanity? The greater the transparency and openness about your methods, the more inclined people will be to trust the results.

Understanding the significance of data is crucial for businesses and individuals alike. Data aids in decision-making, customer understanding, progress evaluation, and adaptable strategies. By dissecting data, businesses can identify customer preferences and adapt accordingly.
Moreover, data science enables the monitoring of customer satisfaction levels and the identification of areas for enhancement.
Also, data science enables proactive strategizing for the future. For example, companies can anticipate market trends and adjust production schedules accordingly, while urban planners can foresee demands for public services based on demographic shifts.
Lastly, data analysis provides a comprehensive understanding of evolving trends over time, offering valuable insights for individual and business development.
To harness the full potential of our data, comprehending its insights is vital. This necessitates a symbiotic relationship between data analytics, transparent communication, trust in data, and a data-driven culture that fosters progressive data cycles, fostering growth and efficiency.
Share the details of your project – like scope, timeframe, or business challenges. Our team will carefully review them and get back to you with the next steps!
contact@datics.ai
+1 (945) 297-6257


The Datics Connection
Your connection to the latest technology news
© 2024 | All Right Revered.
This guide is your roadmap to success! We’ll walk you, step-by-step, through the process of transforming your vision into a project with a clear purpose, target audience, and winning features.